If we take a simple 3 x 3 network of logic gates (N=9) each with 2 input connections (K=2) we can obtain at most 512 different output states. Each contains 9 bits, one for each gate output, so the possibilities range from 000000000 to 111111111 (decimal 0 to 511). The output may prove to be static (a fixed attractor), but in general these networks can develop highly cyclic behaviour and a rich variety of attractors.
In the following examples state space is displayed graphically from 0 at top left to 511 at bottom right, with 32 steps horizontally and 16 vertically. A small box indicates each state (in other words uniquely specifies all the node outputs, a single point in 9 dimensional state space) and a line shows the transitions between each pair of states. The software needed to generate all these maps (ATTRACT.BAS) is available here (in QBASIC & EXE formats).
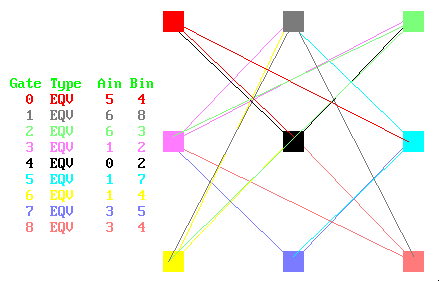
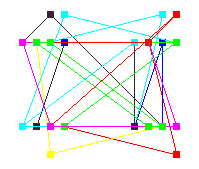
Take a wiring scheme as below - all gates are Equivalence types (EQVs) which give a 1 when both inputs are the same or 0 otherwise. What attractors does this network have ?
In fact there are 4. A point attractor (all 1s or all 0's both give an all 1 output - state 511), plus a cycle of 7 (both shown below, parameters: EQV, seed -5, initial states 511 and 343).
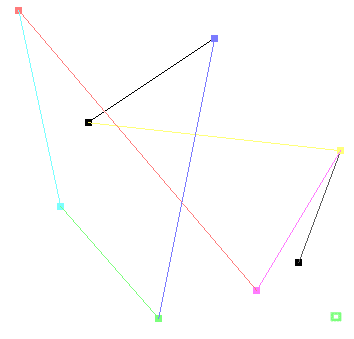
The states comprising the 7 attractor are as follows:011011010 218 101110100 372 000100011 35 100000110 262 110001101 397 001010001 81 010101000 168 then back to 218
The next smallest attractor has a length of 31 steps (parameters EQV, seed -5, initial 340), shown below:
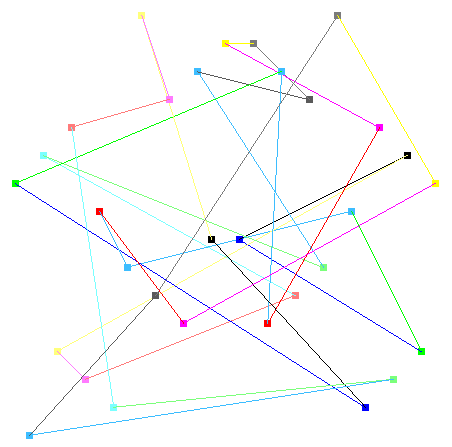
But the final attractor has a whopping 217 length, covering nearly half of the entire state space (parameters: EQV, seed -5). Most of the remaining states comprise the basin of attraction of this attractor, whilst the 31, 7, and 1 attractors have 31, 7 and 1 'Garden of Eden' states respectively (those with no states leading to them):
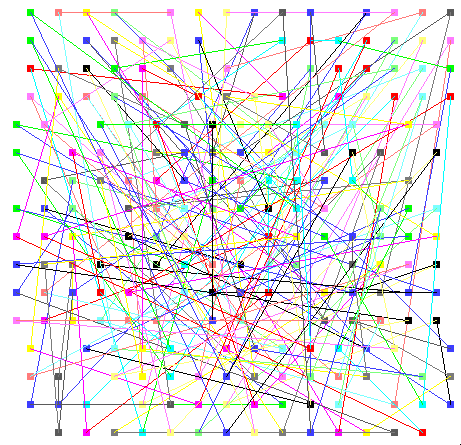
The complete basins of attraction of this network are shown below (from DDLAB).

How much change or perturbation is needed to swap attractors ? This varies a lot, but a single output bit can be sufficient. The next example has 3 attractors, these move between each other freely as the output states are forced to change. Changing the initial state by just 1 decimal digit is often enough to force a move to a new attractor. This may represent anything from 1 to N binary digits of course. In the following case initial decimal positions of 47, 48 and 49 all give different attractors, of length 1, 4 and 4 respectively (with parameters NIF, seed -7).

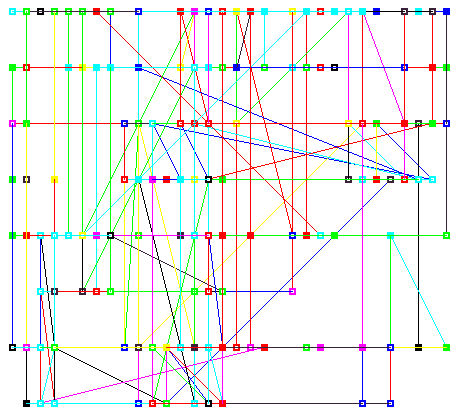
The above networks are updated synchronously (i.e all gates change in unison at every step). What happens if we update them asynchronously (at random) ? This gives a very different result. The permanent attractors then are often all point attractors and the system can swap randomly between many of these over time, resting at each one for a short period, as below (parameters: Random, seed 60552.44, probability 0.11).
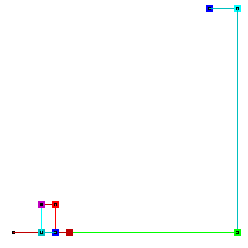
This may suggest that synchrony is an abstraction and unlikely in practice, yet in both artificial neural networks and brains the nodes that happen to fire together will become associated by 'Hebb rule' connectivity enhancements, so over time the synchrony or co-ordination between nodes can increase. In addition, a proof by Nehaniv (2002) has shown that any synchronous system of n nodes can be emulated by an asynchonous system of 3n2 nodes - so all synchronous results will still hold. Yet even in truly random update schemes (only one gate updated each cycle - as emulated by our ASYNC.BAS program) we can still have sequences, as shown below - where the 'square' is a regular (clockwise) repeating sequence of 4 activating point attractor nodes (states 452, 453, 485 and 484 - parameters: Random, random update, seed 4477.3).
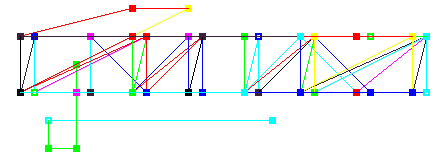
If we increase the probability of multiple nodes being updated at each step then we can obtain another attractor form, the 'transient attractor' where a cycle persists for a short time before moving to another state. This is shown in the following example where attractors of length 1, 4, 5, 6, 7, 8 and 9 appear and disappear in turn during a long and unpredictable sequence (parameters: XOR, seed -8, probability 0.5).
Increasing the probability further to 0.9 and above makes the network nearly synchronous and allows the transient attractors to persist for longer periods, until at p=1 the form to which the network settles has a infinite period - unless perturbed. The next example has attractors of 1, 4 and 5 repeating (parameters: Random, seed -0.9, probability 0.9).
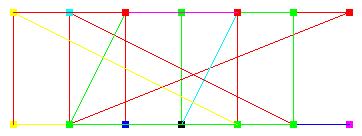
In the next example, a probability of 0.99 switches between several persistent length 4 attractors. This has the same effect as randomly perturbing the gate outputs at regular intervals in a synchronous network. (parameters: Random, seed 0.3, probability 0.99).
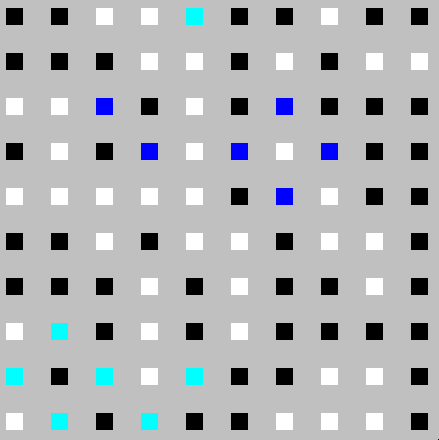
Up until now we have only considered a very small network of 9 gates and have looked at the abstract state map rather than the time dynamics of gate activations (these can be observed by running the programs and selecting the state map). In the natural world, networks are considerably larger, so what difference does this make ? In general, in such cases, we would expect to find several disjoint attractors operating simultaneously, depending upon the local connectivity. In the following (snapshot) state map picture of a 100 gate network (similar in size to the cortical columns in the brain) we see three such attractors, one of 2 gates (upper left in blue), one of 4 (upper right in blue) and a larger one of 7 (bottom left, plus one gate top center, in turquoise). The blue gates cycle on and off each cycle, the turquoise are on for longer periods. All the remaining gates are frozen, either on (white) or off (black), so only 13% of the available gates are active. This network is random with connectivity distance 1 (adjacent gates only).
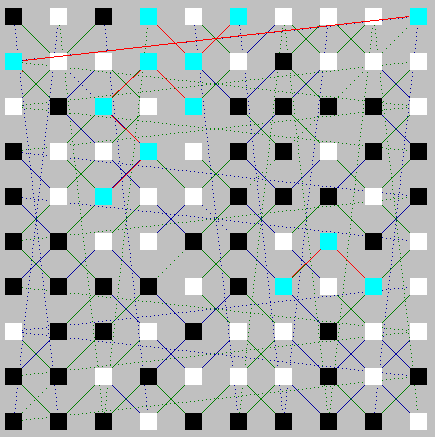
In such networks (which have been modelled by our VARNET.BAS program) it is expected that the perturbations will often have no effect, since most gates are not interconnected. Even where a perturbation disturbs an attractor the effect is often found to be limited to that small locality - these networks can mimic the resilience to change of many bigger organizations. In other (mostly larger) cases these 'islands' of attractor activity (clusters) can be connected by 'bridges', such cross group activations (called 'small world networks') will form naturally as nodes in distant clusters become linked by random connections, such that a perturbation can then propagate all over the network - becoming chaotic in the limit. This 'percolation' ability depends a great deal upon the connectivity, so the following state map explicity shows how such gates can be connected (green for A inputs, blue for B inputs). The connections between active gates are emphasised here in red and thus we can see that four attractors are currently present, 1 comprising 5 gates, 2 comprising 3 gates and 1 comprising 2 gates. These can seem (in the absence of visible wiring) to be forming fewer and larger attractors - it is hard to categorise correctly such networks using any over-simplified 'metric'. Again only 13% of the gates are active in this example (again a random, distance = 1, design) - this can, of course, vary, with more random designs, between 0% (totally static network) and possibly, but most unlikely, 100% (totally chaotic network).
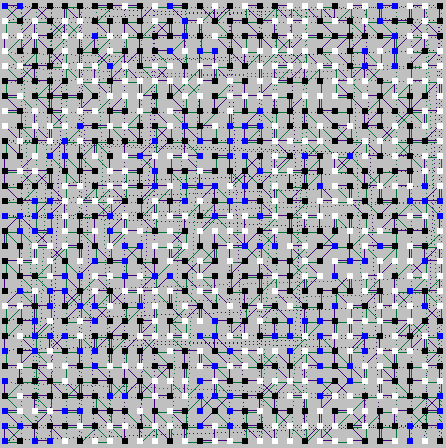
The attractors shown here are just a sample of those available, but indicate some of the possibilities that these Boolean Networks have in modelling cyclic and stochastic (random) processes, in the context of complex systems research, within biological, psychological and social fields. The difficulties in the analysis of such complex networks should also be clear, as the final example of a 900 gate network will demonstrate. Even with connectivity distance limited to 1 for clarity (the dotted lines are wraprounds from one edge to another), understanding the connectivity structure and attractor clusters is very difficult.
Images Page 1 | Page 2 | Page 3 | Page 4 | Page 5a | Page 5b